Nirmohi Kathrecha, a graduate from the School of Environment and Architecture (SEA), is concerned about Mumbai’s outfall levels – points where the city’s drains or sewers empty into the Arabian Sea.
The Intergovernmental Panel of Climate Change (IPCC) predicts a sea-level rise of 0.5 metres by 2051. “This means that Mumbai’s outfall points will be below the sea level or the high-tide line,” Kathrecha says. “A backflow of water from the sea could submerge us.”
The information is alarming.
Kathrecha grew up in Mumbai’s Gorai region where torrential rain and flooding is routine. But solutions for flood mitigation, critical due to an increase in sea levels, are not forthcoming. Long-term resilience measures are possible only after understanding the city’s present complexity. So during the monsoon of 2019, Kathrecha and her 34 classmates at SEA worked on an ambitious project.
They uncovered and mapped R-ward or Borivali’s underground and roadside drainage networks, its natural water systems, and the outfalls. Historical maps and interviews with residents helped them trace the effects of human occupation on flooding patterns. And their research culminated into a study and exhibition called: Of land or water.
Municipal boundaries divide one ward in the city from the other, but water doesn’t obey these prosaic rules. It’s why SEA called their project “Of land or water” emphasising the land-water dependence and looking at watersheds instead of administrative borders. “In mapping the ward, we started to look at water systems more cohesively and planned short-term and long-term interventions,” Kathrecha adds.
Land Under Water
At first, the students took stock of the current monsoon conditions in Mumbai. They found that the average high rainfall of the last six years is 250mm per day. The highest in the last decade, based on the rainfall of 29 August 2017, was 500mm. The season’s most catastrophic was 900mm per day, based on data from 26 July 2005. Then they divided R-ward into five zones: zone 0-4, that are vulnerable to flooding.
On ground, ideas of 250mm or 900mm rainfall don’t mean much. So they mapped the region based on vocabularies heard from residents such as “ankle-length” waterlogging or “calf-length”, “knee-length”, or “shoulder-length”.
The students then overlaid this data with the type of settlement and mapped high-risk areas because of heavy rainfall and high-tidal conditions. They also marked a projected high tidal line in 2051 (in pink). The exercise helped them deduce that nearly 23% of the urbanised area will be submerged during a high rainfall plus high tide event. That one in every five people in “squatter settlements” is vulnerable.
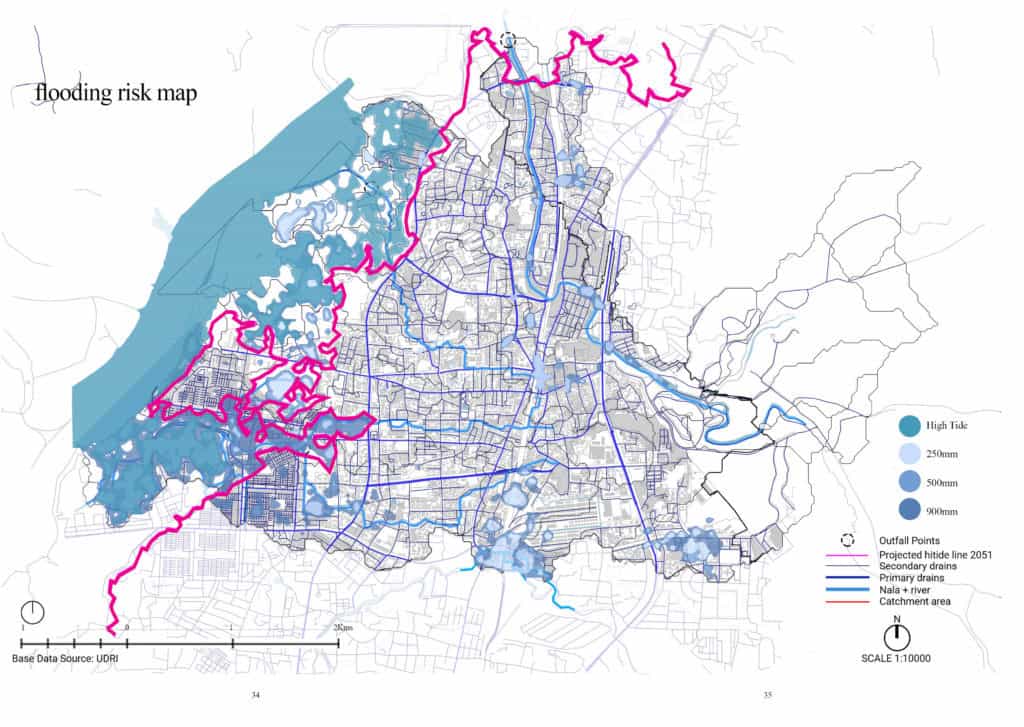
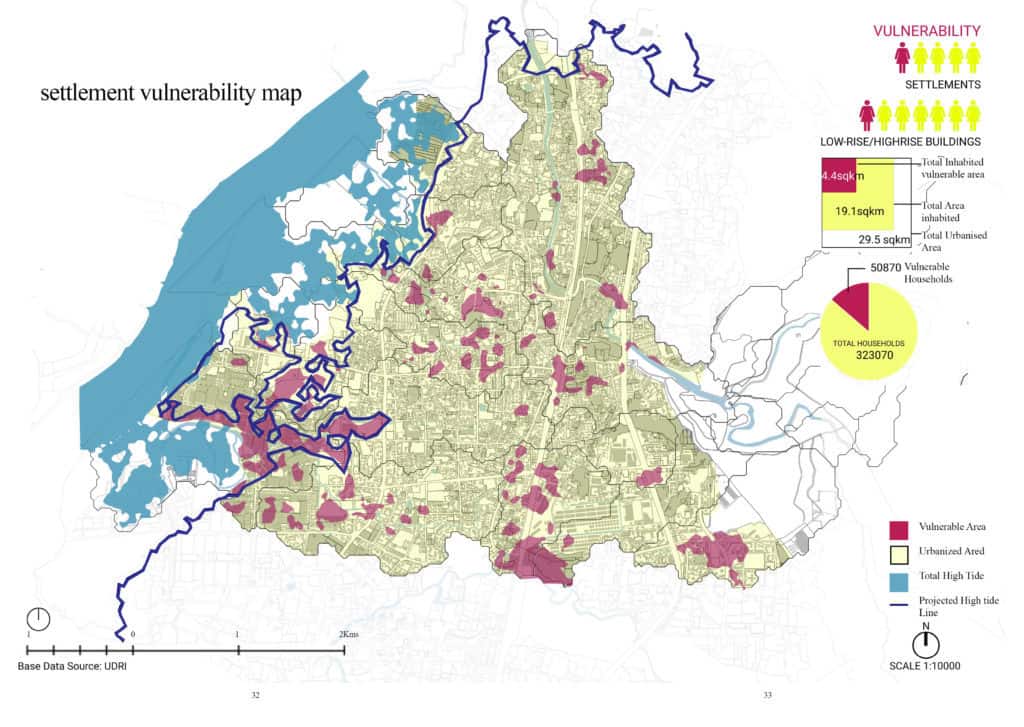
Nearly 23% of the urbanised area in R-ward will be submerged during a high rainfall plus high tide event. One in every five people in “squatter settlements” is vulnerable.
Of land and water, SEA
Streets As Rivers
In the late 1890s, Borivali consisted of gaothans like Eksar, Mandapeshwar, Kanheri, Gorai, and others. It was a series of mudflats with the occasional rocky interruption. “You could never be sure what part of land was climbing up, what sloping down. The relationship between land and water was temporal,” says Vastavikta Bhagat, Assistant Professor at SEA, who guided the students through the study.
Once the railway line was laid, Borivali prospered. Many traders flocked to buy land and build quaint holiday homes. “It was the Alibag of the 1900s”, Bhagat says.
Floods have been common in Borivali since the late 1960s, Bhagat adds, “but waterlogging and flooding has increased in the past two decades.”
From a productive agricultural landscape, Borivali became a settling space, and invited infrastructural development. The initial flow of water was from the higher ground in the east, which is the Sanjay Gandhi National Park, to the Gorai creek in the west, according to Bhagat.
As land was built upon, drainage was overlooked. The built form obstructed the flow of water from east to west.
The natural water systems, too, were compromised. Retaining walls were erected around the rivers, their mouths were narrowed, and the floodplains reduced. Take the Dahisar river, for instance. Bhagat explains that at one point in Borivali east, its bend was gentle, but when land was reclaimed, it was made into a sharp, 90 degree turn. Unsurprisingly, that region now floods.
Then roads became the rivers or the open drains that carried water. But roads were built on a higher ground, often perpendicular to the flow of water, Bhagat says. This again blocked the natural flow of water towards the mangroves and the creek in the west.
Now, water doesn’t follow the gradient of land but is forced out through Mumbai’s dysfunctional drainage network. After the 2005 floods, the Brihanmumbai Stormwater Disposal System (BRIMSTOWAD) project took up the expansion of the drainage network in R-ward on priority, but 15 years later, the School of Environment and Architecture found that only 40% of the work is completed.
Wide-scale new construction along river edges, floodplains, and elevated land followed. Once again, builders and the municipal corporation ignored the natural contours of the flow of the water. As a result, the “original settlements like Eksar Dongri and Naitodi which originally sat on higher grounds now remain flooded for most of the monsoon season,” the study found.
Zone-wise planning
The senior students at SEA classified the ward into five zones most likely to flood. Zone 0 is along the Gorai creek. This is a high-risk, flood-prone area and the students suggest that there shouldn’t be any built structures here, only open spaces. Zone 1 and zone 2 is along the nallahs/streams that flow through the ward. Zone 1 is under the projected future high-tide line and the students suggest that the roads in this zone need to be raised. Zone 2, according to them, must only have flood-resistant built form, while Zone 3 has no such restrictions. Zone 4 is the safest zone.

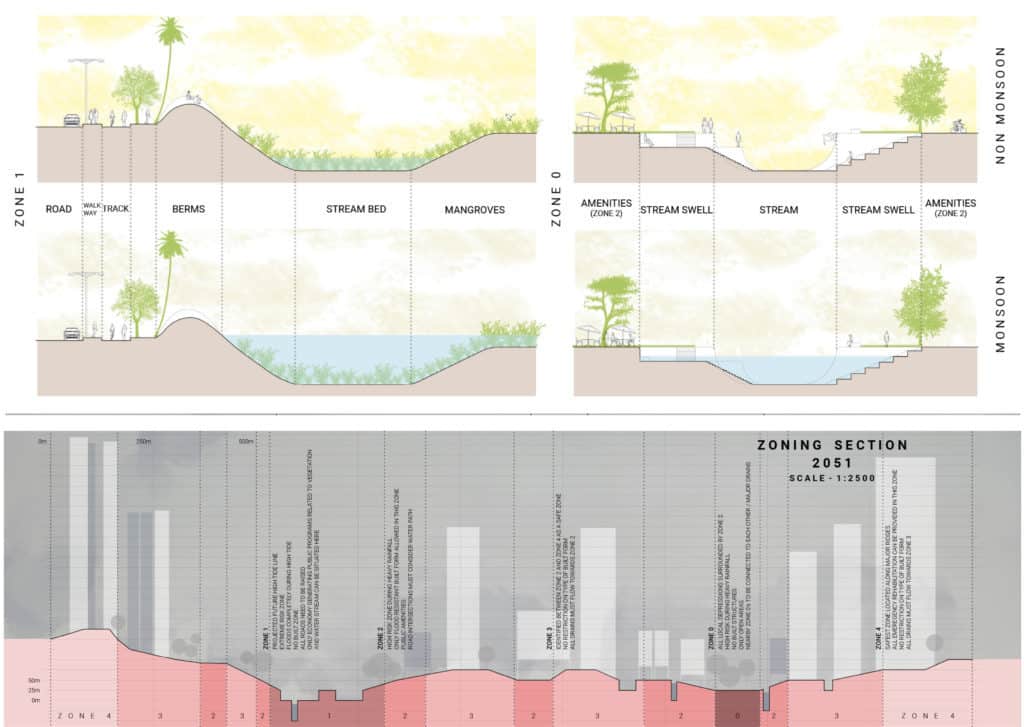
The suggestions also include built-form strategies for low-risk zones and the need to rehabilitate people to safer areas. As others who’ve studied Mumbai’s flooding patterns or built-form will attest, mangroves are essential safeguards against flooding. The students’ open space design incorporates planting mangroves as well as creating stream beds as holding ponds for water percolation.
At a time when water no longer flows from the higher ground into the sea, nor do the drains safely see it out, students are asking if drains can become percolators to store rainwater.
We want to understand how to create a flood-resistant city, Kathrecha says. But the project has invoked many more questions in the minds of the students and faculty. Especially around our relationship with water, and ideas around living with water, instead of fighting it.
The study was conducted by Ravindra Punde, Abhijit Ekbote, Komal Gopwani and Vastavikta Bhagat, along with the senior students of SEA.